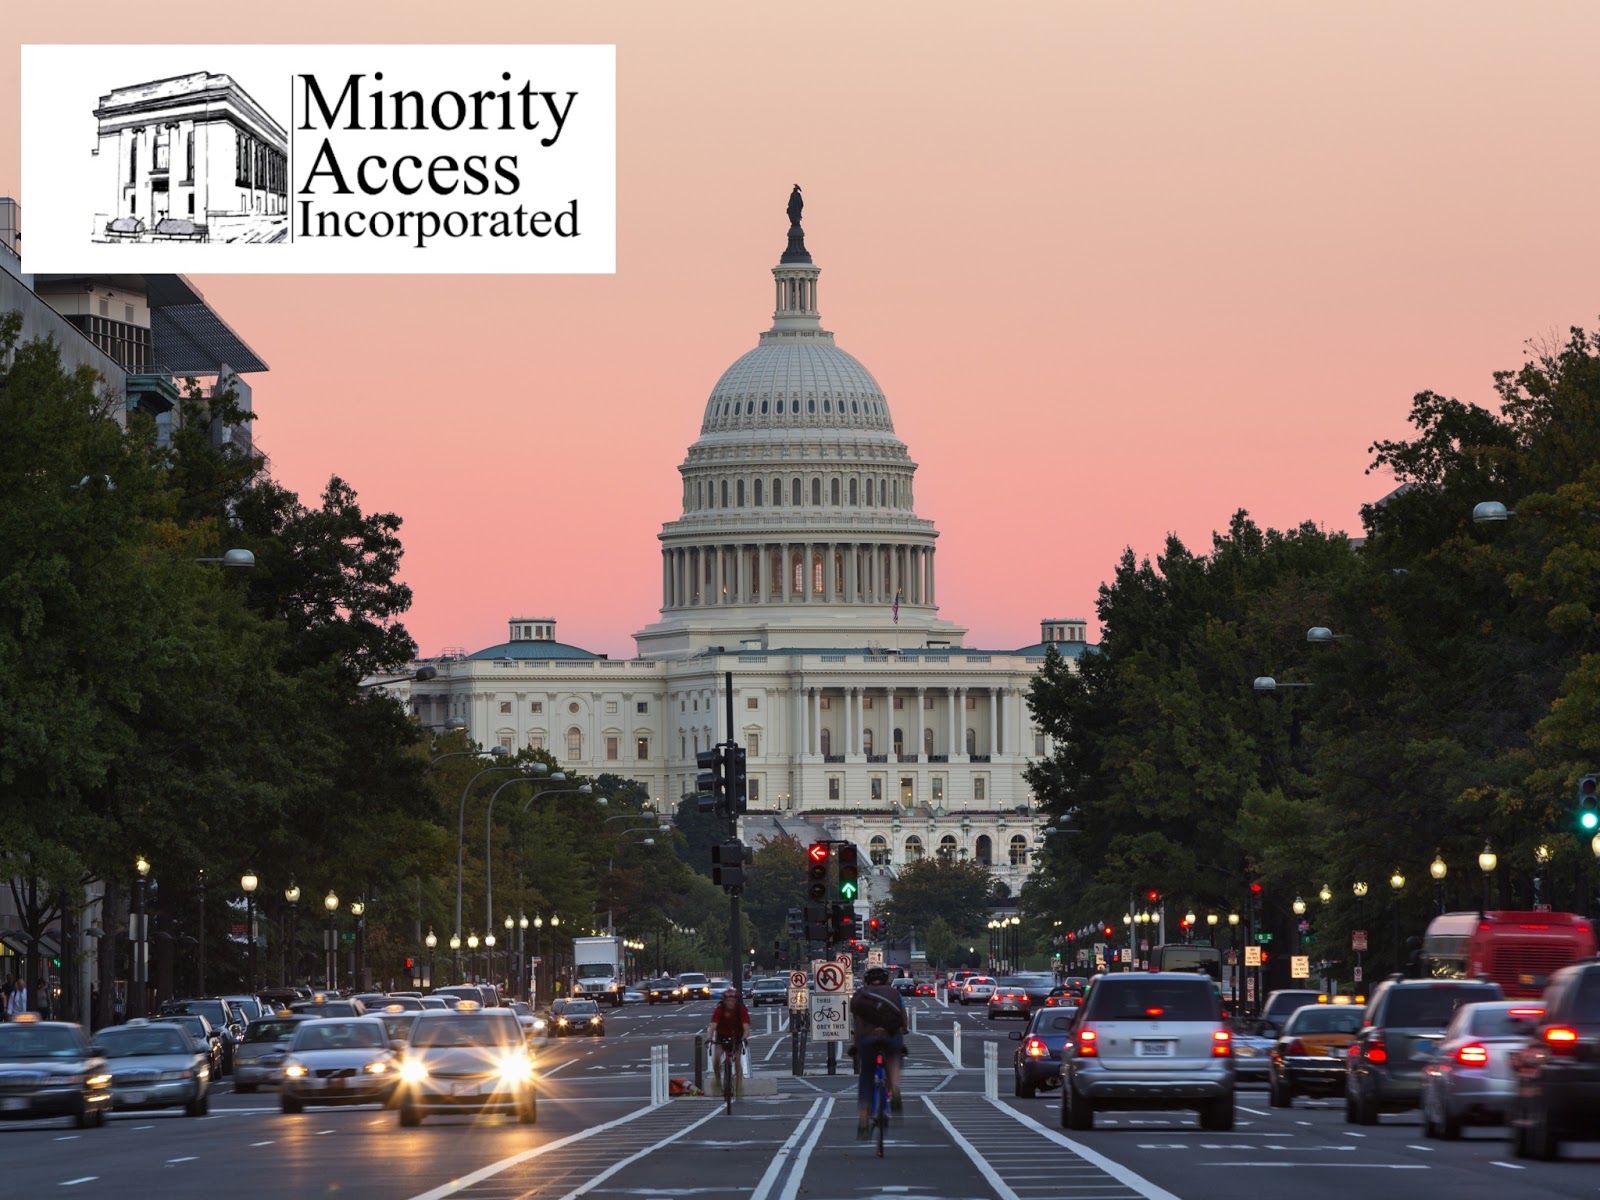
This week I am excited to say that I will be attending the 19th Annual Minority Access Conference in Washington D.C. and I will be given the opportunity to represent the research I have been doing on microplastics for the past year and a half. I am beyond grateful to be given this opportunity, being able to present what I have been working on for so long, and also getting the chance to take a look at other peoples research as well. I am going to use this trip as a learning experience because there is going to be so many workshops and I will be learning tools that will be able to help me become a better presenter and a better researcher in my future studies. I will be leaving this Thursday, so wish me luck!


Comments
Post a Comment